Window functions in Microsoft SQL Server are powerful tools for performing calculations across a specified range of rows related to the current row within the result set. These functions fall into several categories based on their behavior and purpose.
To demonstrate the functions, let us create some sample data.
Sample Data:
CREATE DATABASE PRACTICE_DB;
USE PRACTICE_DB
GO

CREATE TABLE PRODUCTS
(
  PRODUCT_ID        INT
, PRODUCT_NAME      CHAR(255)
, PRODUCT_CATEGORY  CHAR(255)
, PRODUCT_PRICE     FLOAT
, CURRENCY          CHAR(5)
);

INSERT INTO PRODUCTS (PRODUCT_ID, PRODUCT_NAME, PRODUCT_CATEGORY, PRODUCT_PRICE, CURRENCY) VALUES (1, 'Soap', 'Beauty Products', 25, 'GBP');
INSERT INTO PRODUCTS (PRODUCT_ID, PRODUCT_NAME, PRODUCT_CATEGORY, PRODUCT_PRICE, CURRENCY) VALUES (2, 'TV', 'Electronics', 500, 'GBP');
INSERT INTO PRODUCTS (PRODUCT_ID, PRODUCT_NAME, PRODUCT_CATEGORY, PRODUCT_PRICE, CURRENCY) VALUES (3, 'Laptop', 'Electronics', 900, 'GBP');
INSERT INTO PRODUCTS (PRODUCT_ID, PRODUCT_NAME, PRODUCT_CATEGORY, PRODUCT_PRICE, CURRENCY) VALUES (4, 'Hand cream', 'Beauty Products', 10, 'GBP');
INSERT INTO PRODUCTS (PRODUCT_ID, PRODUCT_NAME, PRODUCT_CATEGORY, PRODUCT_PRICE, CURRENCY) VALUES (5, 'Barbie', 'Toys', 56, 'GBP');
INSERT INTO PRODUCTS (PRODUCT_ID, PRODUCT_NAME, PRODUCT_CATEGORY, PRODUCT_PRICE, CURRENCY) VALUES (6, 'Mobile', 'Electronics', 500, 'GBP');

CREATE TABLE PRODUCT_SALES
(
  SALES_ID          INT
, PRODUCT_ID        INT
, SALES_QUANTITY    INT
, SALES_DATE        DATE
);

INSERT INTO PRODUCT_SALES (SALES_ID, PRODUCT_ID, SALES_QUANTITY, SALES_DATE) VALUES (101, 1, 5, '2023-09-01');
INSERT INTO PRODUCT_SALES (SALES_ID, PRODUCT_ID, SALES_QUANTITY, SALES_DATE) VALUES (102, 2, 1, '2022-12-01');
INSERT INTO PRODUCT_SALES (SALES_ID, PRODUCT_ID, SALES_QUANTITY, SALES_DATE) VALUES (103, 3, 2, '2022-11-01');
INSERT INTO PRODUCT_SALES (SALES_ID, PRODUCT_ID, SALES_QUANTITY, SALES_DATE) VALUES (104, 4, 3, '2023-09-15');
INSERT INTO PRODUCT_SALES (SALES_ID, PRODUCT_ID, SALES_QUANTITY, SALES_DATE) VALUES (105, 5, 5, '2022-07-01');
INSERT INTO PRODUCT_SALES (SALES_ID, PRODUCT_ID, SALES_QUANTITY, SALES_DATE) VALUES (105, 1, 6, '2021-12-17');
INSERT INTO PRODUCT_SALES (SALES_ID, PRODUCT_ID, SALES_QUANTITY, SALES_DATE) VALUES (105, 5, 7, '2023-05-01');
Below are the main categories of window functions:
1. Ranking Functions:
- ROW_NUMBER():
Syntax:
SELECT
    column1, column2, ...,
    ROW_NUMBER() OVER (PARTITION BY partition_column ORDER BY order_column) AS RowNum
FROM
    table_name;
SELECT PRODUCT_CATEGORY, CURRENCY,
    ROW_NUMBER() OVER (ORDER BY PRODUCT_CATEGORY DESC) AS RowNum
FROM PRODUCTS;
Example:
Output:
- RANK(): It is a window function in MSSQL that assigns a unique rank to each distinct row within the result set. It is commonly used for ranking items based on a specified order.
Syntax:
SELECT
    column1, column2, ...,
    RANK() OVER (PARTITION BY partition_column ORDER BY order_column) AS Rank
FROM
    table_name;
Example:
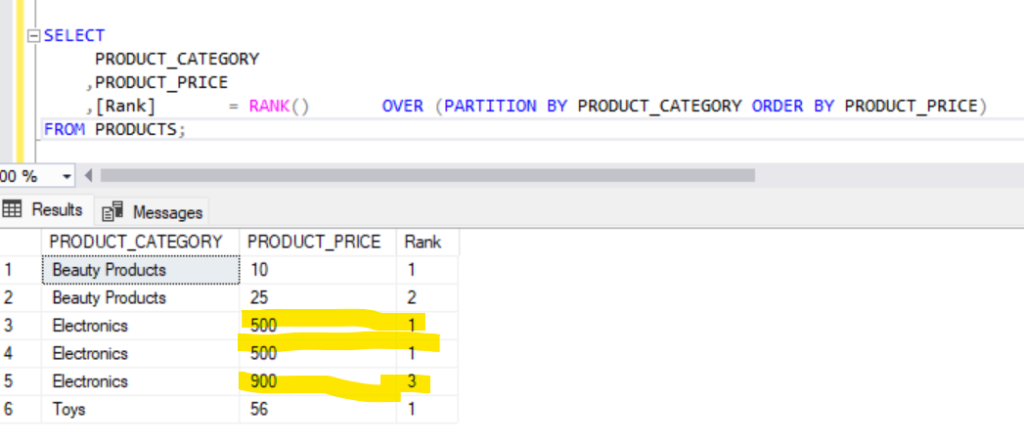
SELECT
     PRODUCT_CATEGORY
    ,PRODUCT_PRICE
    ,[Rank]  = RANK() OVER (PARTITION BY PRODUCT_CATEGORY ORDER BY PRODUCT_PRICE)
FROM PRODUCTS;
Output:
In the above example, we could see that the RANK() function orders the product prices of each product category by assigning a rank to it.
We can also observe here, that for same Products and same price, the RANK() function assigns the same rank (in this example, the rank is 1) and for the next price of that same Product category, it leaves a gap and picks the next number (the rank is 3)
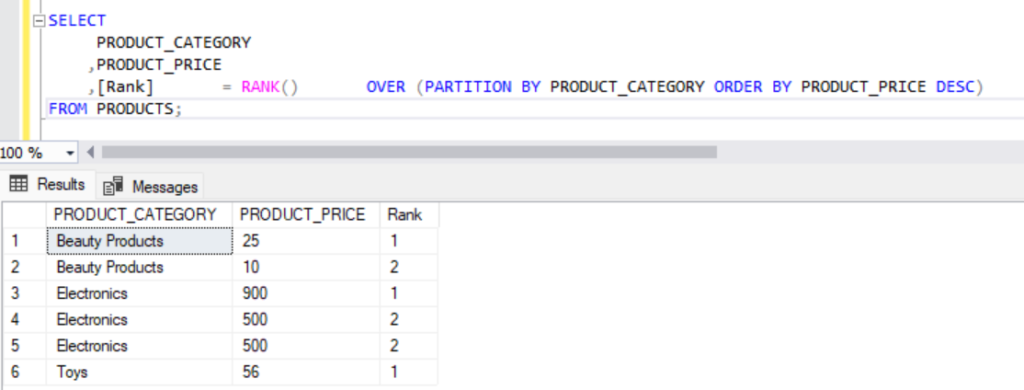
We could also reverse the order of the rank using DESC as below.
- DENSE_RANK():
- Similar to RANK, but without gaps between the ranks.
Syntax:
SELECT
    column1, column2, ...,
    DENSE_RANK() OVER (PARTITION BY partition_column ORDER BY order_column) AS DenseRank
FROM
    table_name;
Example:
SELECT
     PRODUCT_CATEGORY
	,PRODUCT_PRICE
     ,[DenseRank]  = DENSE_RANK() OVER (PARTITION BY PRODUCT_CATEGORY ORDER BY PRODUCT_PRICE)
FROM PRODUCTS;
Output:
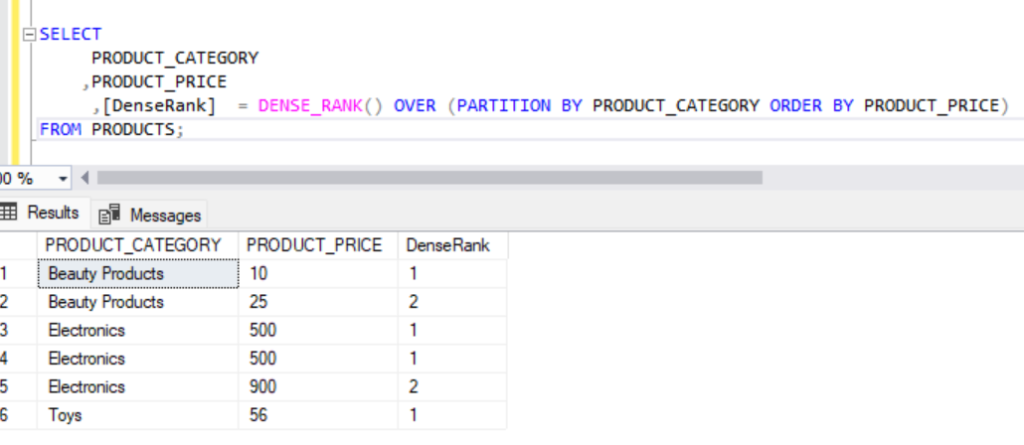
Here, we don’t see any gaps in the ‘Electronics’ Product category. If the price is same, both gets the rank 1, and then it moves to rank 2.
- NTILE():
The NTILE function in Microsoft SQL Server is a window function that assigns a bucket number to each row within a partition of a result set. This bucket number represents the percentile group to which the row belongs. The NTILE function is useful for dividing the result set into a specified number of roughly equal parts.
Syntax:
SELECT
    column1, column2, ...,
    NTILE(number_of_buckets) OVER (PARTITION BY partition_column ORDER BY order_column) AS Bucket
FROM
    table_name;
Example:
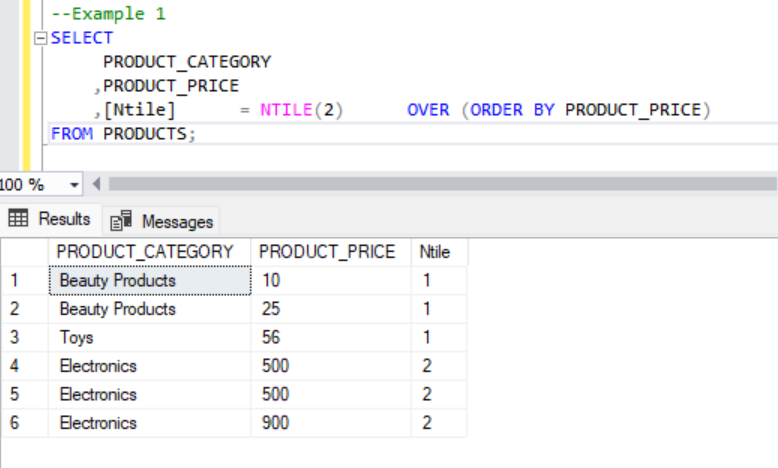
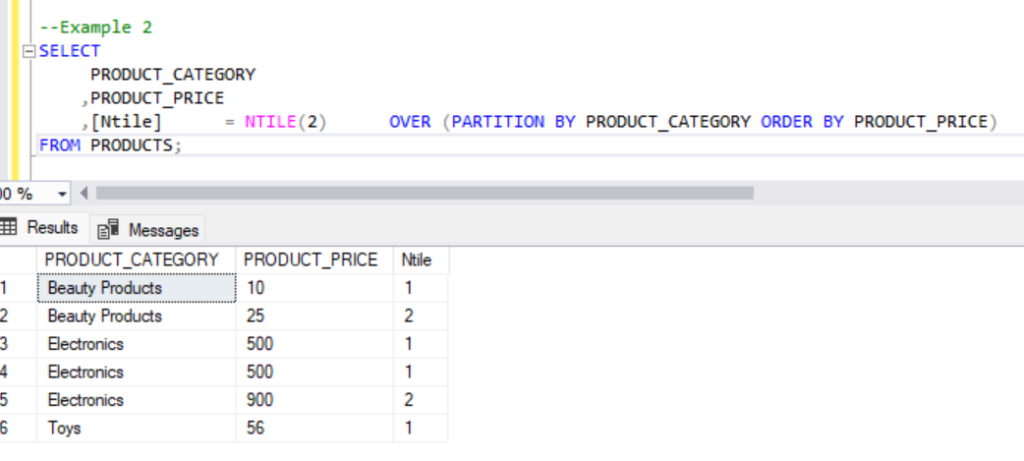
--Example 1
SELECT
     PRODUCT_CATEGORY
	,PRODUCT_PRICE
    ,[Ntile]      = NTILE(2)      OVER (ORDER BY PRODUCT_PRICE)
FROM PRODUCTS;

--Example 2
SELECT
     PRODUCT_CATEGORY
	,PRODUCT_PRICE
    ,[Ntile]      = NTILE(3)      OVER (PARTITION BY PRODUCT_CATEGORY ORDER BY PRODUCT_PRICE)
FROM PRODUCTS;
Output:
For the first example, we divide the results in 2 equal buckets
For the second example, we are dividing the results into 2 buckets and we are partitioning the results by product category.
Below, we can see for the ‘Electronics’ product category with same product price belong to the same bucket.
2. Aggregate Functions with OVER:
- SUM(): The
SUM()function with theOVERclause is often used to calculate cumulative or running totals over a specified window or partition of rows within a result set.
Syntax:
SELECT
    column1,
    column2,
    ...,
    SUM(column_to_sum) OVER (PARTITION BY partition_column ORDER BY order_column) AS sum_result
FROM
    your_table;
Example:
--Example 1
SELECT SALES_DATE
,PRODUCT_CATEGORY
, PRODUCT_NAME
, PRODUCT_PRICE
,SUM(PRODUCT_PRICE) OVER (ORDER BY SALES_DATE) AS sum_result
FROM PRODUCTS P
JOIN PRODUCT_SALES PS
ON P.PRODUCT_ID = PS.PRODUCT_ID;
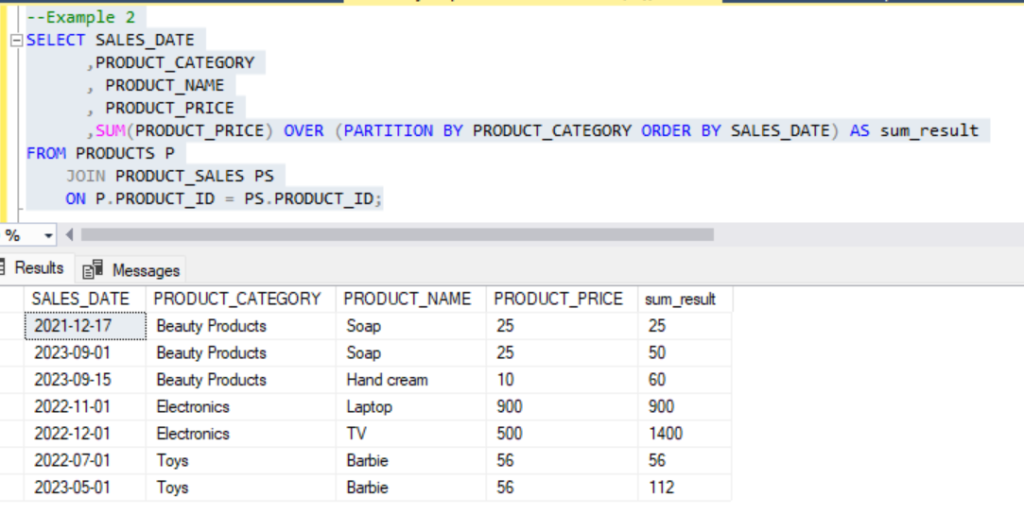
--Example 2
SELECT SALES_DATE
,PRODUCT_CATEGORY
, PRODUCT_NAME
, PRODUCT_PRICE
,SUM(PRODUCT_PRICE) OVER (PARTITION BY PRODUCT_CATEGORY ORDER BY SALES_DATE) AS sum_result
FROM PRODUCTS P
JOIN PRODUCT_SALES PS
ON P.PRODUCT_ID = PS.PRODUCT_ID;Output:
For example 1, we did not partition the result. Therefore, the results will be first ordered by sales date and the each entry will be cummulated. The final row will have the total sales.
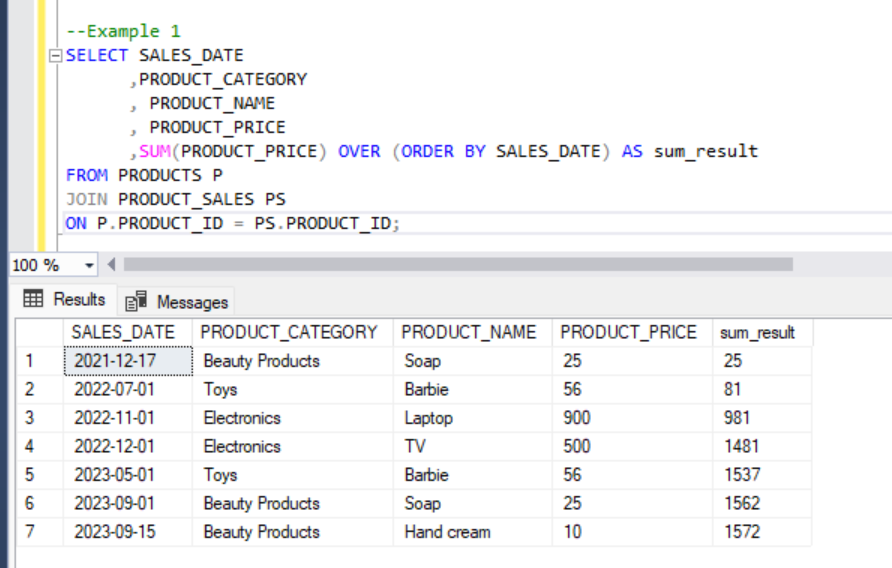
If we observe the results in sum_result column, we can see the first sales amount was 25. The next sales would be 25+56 = 81 and the next sale will add up to the previous sale (81 + 900 = 981) and so on. The final row will have the cumulative sales amount.
In example 2, we partition the results by Product_category.
- AVG(): Calculates the average of a numeric column over a specified range of rows.
Syntax:
SELECT
    column1,
    column2,
    ...,
    AVG(column_to_sum) OVER (PARTITION BY partition_column ORDER BY order_column) AS avg_result
FROM
    your_table;
Example:
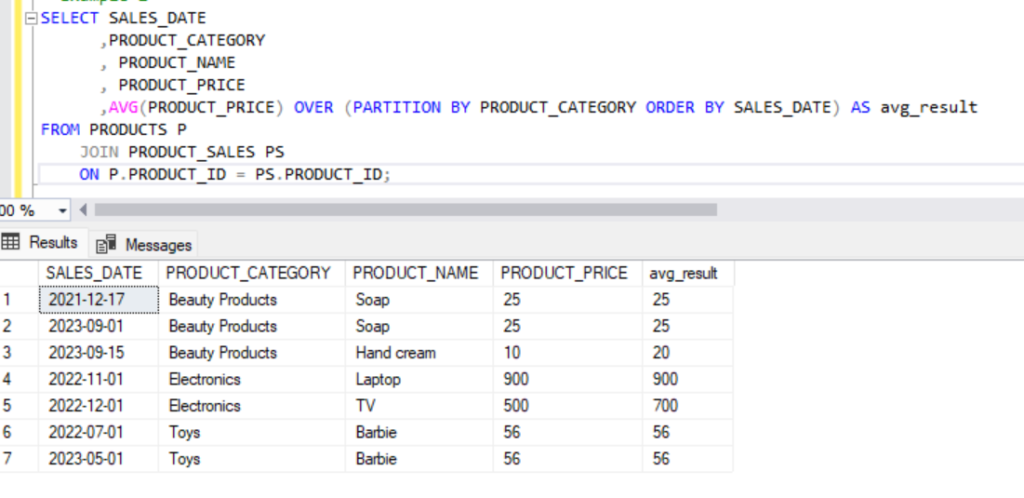
SELECT SALES_DATE
      ,PRODUCT_CATEGORY
	  , PRODUCT_NAME
	  , PRODUCT_PRICE
      ,AVG(PRODUCT_PRICE) OVER (PARTITION BY PRODUCT_CATEGORY ORDER BY SALES_DATE) AS avg_result
FROM PRODUCTS P
    JOIN PRODUCT_SALES PS
	ON P.PRODUCT_ID = PS.PRODUCT_ID;
Output:
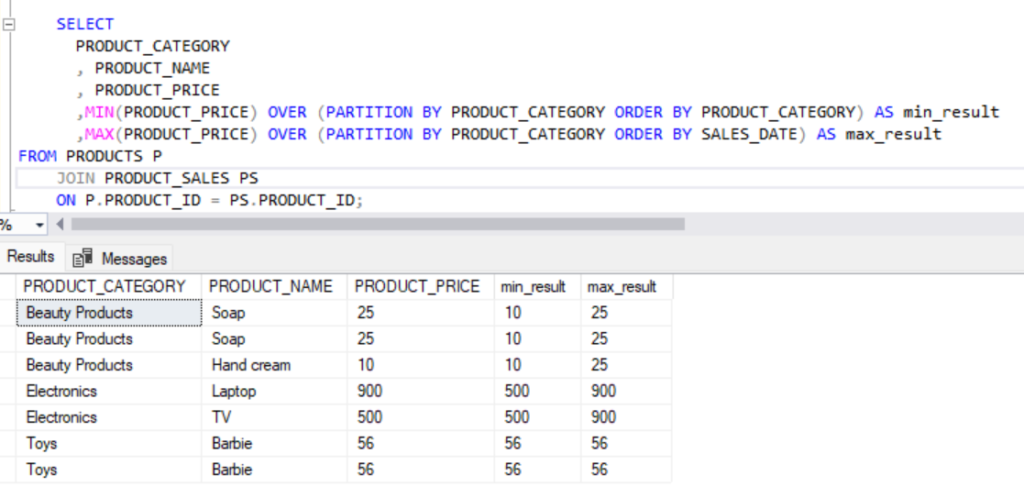
- MIN() and MAX(): Returns the minimum or maximum value of a column over a specified range of rows.
Example:
SELECT
      PRODUCT_CATEGORY
	  , PRODUCT_NAME
	  , PRODUCT_PRICE
        ,MIN(PRODUCT_PRICE) OVER (PARTITION BY PRODUCT_CATEGORY ORDER BY PRODUCT_CATEGORY) AS min_result
	,MAX(PRODUCT_PRICE) OVER (PARTITION BY PRODUCT_CATEGORY ORDER BY SALES_DATE) AS max_result
FROM PRODUCTS P
    JOIN PRODUCT_SALES PS
	ON P.PRODUCT_ID = PS.PRODUCT_ID;
Output:
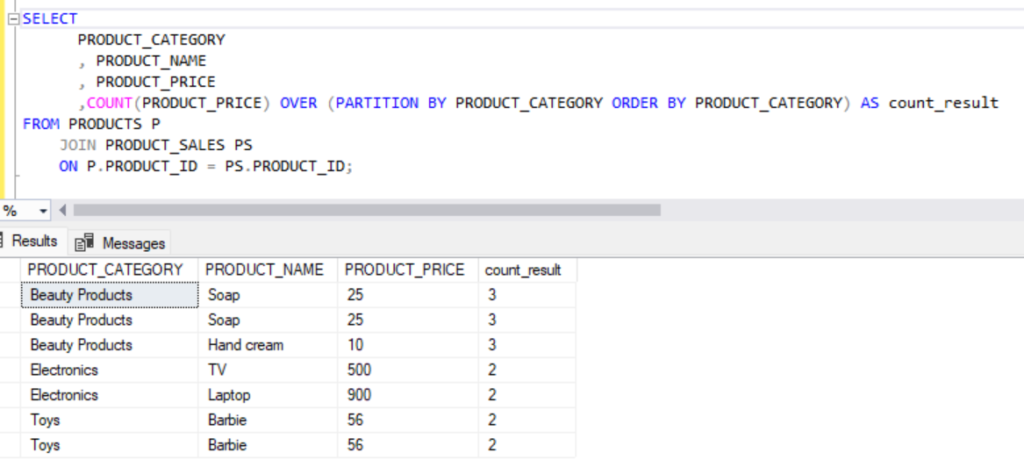
- COUNT(): Counts the number of rows over a specified range.
Example:
SELECT
      PRODUCT_CATEGORY
	  , PRODUCT_NAME
	  , PRODUCT_PRICE
      ,COUNT(PRODUCT_PRICE) OVER (PARTITION BY PRODUCT_CATEGORY ORDER BY PRODUCT_CATEGORY) AS count_result
FROM PRODUCTS P
    JOIN PRODUCT_SALES PS
	ON P.PRODUCT_ID = PS.PRODUCT_ID;
Output:
3. Analytic Functions:
n Microsoft SQL Server, the LEAD and LAG functions are window functions that provide access to subsequent and preceding rows in a result set without using a self-join. These functions are useful for comparing values with the next or previous rows.
- LEAD(): The
LEADfunction provides access to the value of a specified expression in the next row within the result set.
Syntax:
SELECT
    column1,
    column2,
    LEAD(column1) OVER (ORDER BY order_column) AS NextValue
FROM
    your_table;
Example:
SELECT
            PRODUCT_CATEGORY
	  , PRODUCT_NAME
	  , PRODUCT_PRICE
          , LEAD(PRODUCT_PRICE) OVER (ORDER BY PRODUCT_CATEGORY) AS NextValue
FROM PRODUCTS P
    JOIN PRODUCT_SALES PS
	ON P.PRODUCT_ID = PS.PRODUCT_ID;
In this example, LEAD(PRODUCT_PRICE) OVER (ORDER BY PRODUCT_CATEGORY) retrieves the value of PRODUCT_PRICEPRODUCT_CATEGORY
Output:
Executing the above query will give the following result.
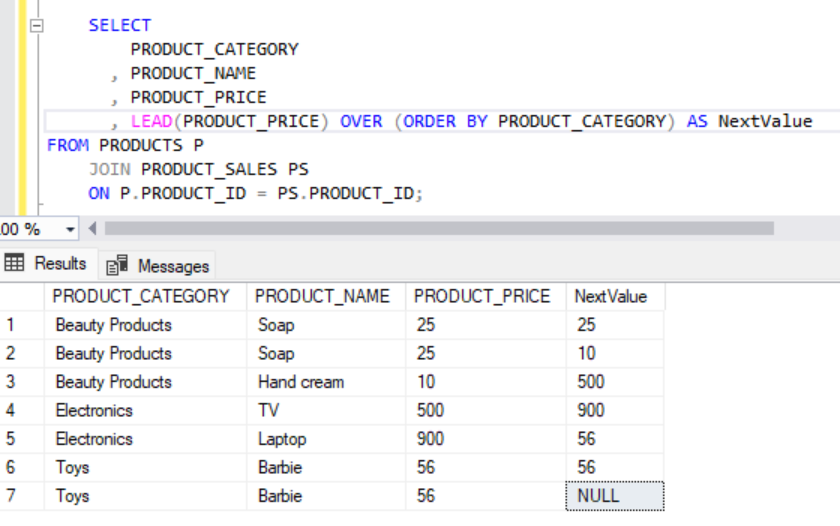
Note: The last value of the Next Value column is NULL, as there are no rows following the current row.
- LAG(): The
LAGfunction provides access to the value of a specified expression in the previous row within the result set.
Syntax:
SELECT
    column1,
    column2,
    LAG(column1) OVER (ORDER BY order_column) AS PreviousValue
FROM
    your_table;
Example:
SELECT
            PRODUCT_CATEGORY
	  , PRODUCT_NAME
	  , PRODUCT_PRICE
          , LAG(PRODUCT_PRICE) OVER (ORDER BY PRODUCT_CATEGORY) AS PreviousValue
FROM PRODUCTS P
    JOIN PRODUCT_SALES PS
	ON P.PRODUCT_ID = PS.PRODUCT_ID;
Output:
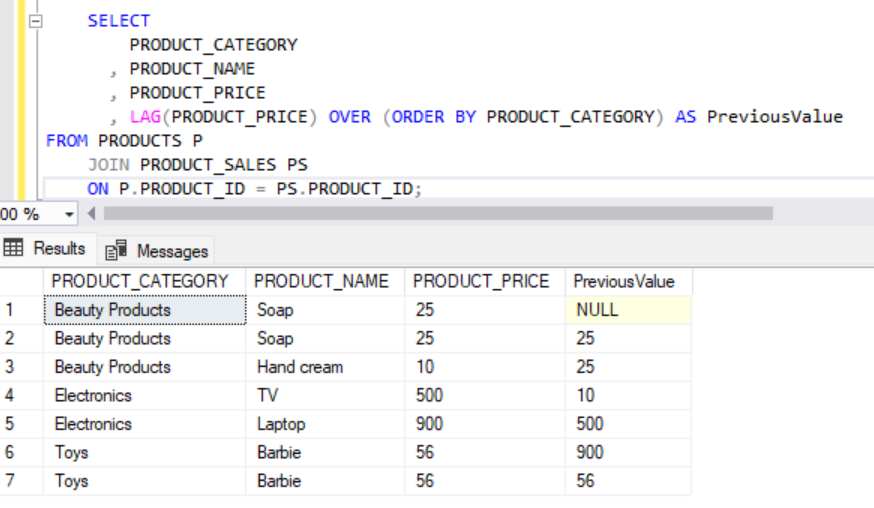
In this example, we see that the value is NULL for the PreviousValue column of the first row, as we don’t have any previous row.
- FIRST_VALUE() and LAST_VALUE():
In Microsoft SQL Server, the FIRST_VALUE and LAST_VALUE functions are window functions that allow you to access the first and last values within a specified window or partition of rows in a result set. These functions are particularly useful when you want to retrieve specific values based on a defined order within a subset of rows.
- FIRST_VALUE(): The
FIRST_VALUEfunction retrieves the value of a specified expression for the first row within a window.
Syntax:
SELECT
    column1,
    FIRST_VALUE(column1) OVER (PARTITION BY partition_column ORDER BY order_column) AS FirstValue
FROM
    your_table;
Example:
SELECT
        PRODUCT_CATEGORY
      , PRODUCT_NAME
      , PRODUCT_PRICE
      , FIRST_VALUE(PRODUCT_PRICE) OVER (PARTITION BY PRODUCT_CATEGORY ORDER BY PRODUCT_CATEGORY) AS FirstValue
FROM PRODUCTS P
JOIN PRODUCT_SALES PS
ON P.PRODUCT_ID = PS.PRODUCT_ID;
In this example, FIRST_VALUE(PRODUCT_PRICE) OVER (PARTITION BY PRODUCT_CATEGORY ORDER BY PRODUCT_CATEGORY) retrieves the value of PRODUCT_PRICEPRODUCT_CATEGORY
Output:
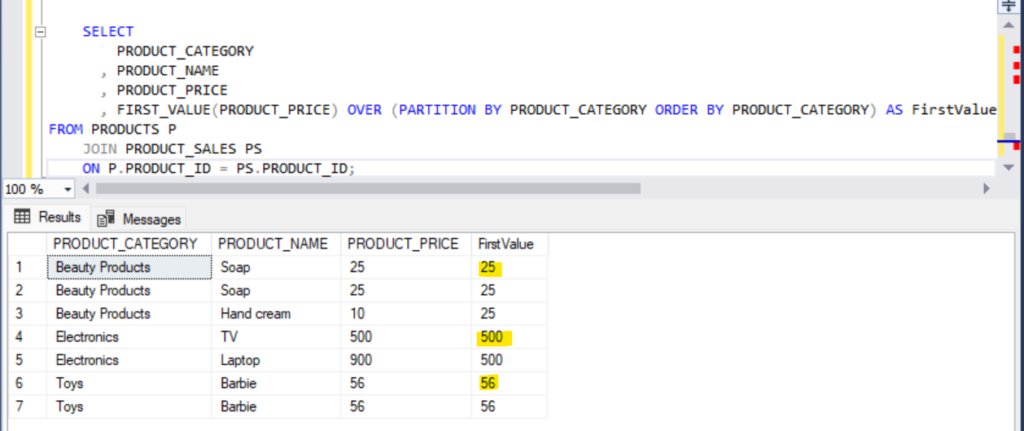
Here, we see that for each PRODUCT_CATEGORY, the first value of PRODUCT_PRICE is retrieved.
- LAST_VALUE(): The
LAST_VALUEfunction retrieves the value of a specified expression for the last row within a window.
Syntax:
SELECT
    column1,
    LAST_VALUE(column1) OVER (PARTITION BY partition_column ORDER BY order_column) AS LastValue
FROM
    your_table;
Example:
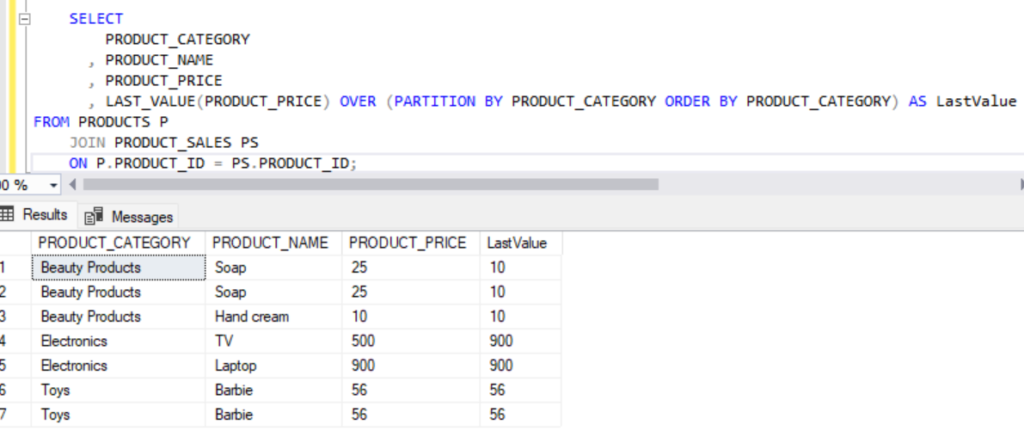
SELECT
        PRODUCT_CATEGORY
	  , PRODUCT_NAME
	  , PRODUCT_PRICE
      , LAST_VALUE(PRODUCT_PRICE) OVER (PARTITION BY PRODUCT_CATEGORY ORDER BY PRODUCT_CATEGORY) AS LastValue
FROM PRODUCTS P
    JOIN PRODUCT_SALES PS
	ON P.PRODUCT_ID = PS.PRODUCT_ID;
Output:
4. Percentile Functions:
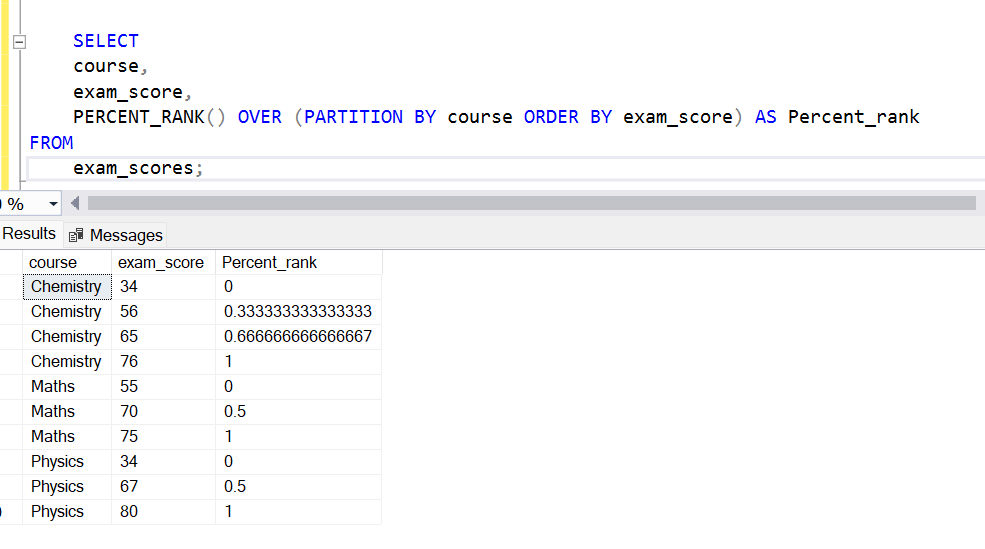
- PERCENT_RANK(): is a window function that calculates the relative rank of a row within a result set, based on its position with respect to other rows. The result is expressed as a percentile value between 0 and 1.
Syntax:
SELECT
    column1,
    column2,
    ...,
    PERCENT_RANK() OVER (PARTITION BY partition_column ORDER BY order_column) AS PercentRank
FROM
    your_table;
Example:
CREATE TABLE exam_scores (
    student_id INT,
	course VARCHAR(25),
    exam_score INT
);

insert into exam_scores (student_id, course, exam_score) values (1, 'Physics', 80);
insert into exam_scores (student_id, course, exam_score) values (2, 'Maths', 70);
insert into exam_scores (student_id, course, exam_score) values (3, 'Chemistry', 65);
insert into exam_scores (student_id, course, exam_score) values (4, 'Physics', 34);
insert into exam_scores (student_id, course, exam_score) values (1,'Maths', 75);
insert into exam_scores (student_id, course, exam_score) values (6, 'Chemistry' , 34);
insert into exam_scores (student_id, course, exam_score) values (3, 'Maths', 55);
insert into exam_scores (student_id, course, exam_score) values (8, 'Chemistry', 76);
insert into exam_scores (student_id, course, exam_score) values (9, 'Chemistry', 56);
insert into exam_scores (student_id, course, exam_score) values (10, 'Physics', 67);

SELECT
    course,
	exam_score,
    PERCENT_RANK() OVER (PARTITION BY course ORDER BY exam_score) AS Percent_rank
FROM
    exam_scores;
Output:
More about the PERCENT_RANK() function can be found in this link.
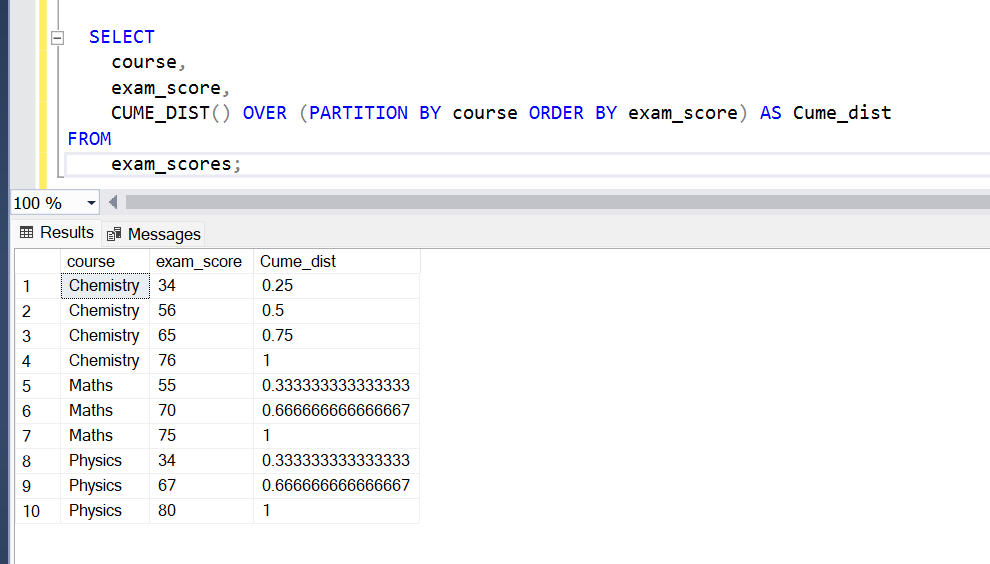
- CUME_DIST(): Calculates the cumulative distribution of a value within a partition as a percentage.
Here’s how it works:
- First, it orders the rows within each partition.
- Then, it calculates the relative rank of each row in the partition. This is done by dividing the number of rows that precede or are equal to the current row by the total number of rows in the partition.
- Finally, it returns the cumulative distribution of each row in the partition.
Syntax:
CUME_DIST() OVER (
    [PARTITION BY partition_expression]
    ORDER BY order_expression
)
More about CUME_DIST() function can be found here.
Example:
  SELECT
    course,
	exam_score,
    CUME_DIST() OVER (PARTITION BY course ORDER BY exam_score) AS Cume_dist
FROM
    exam_scores;
Output:
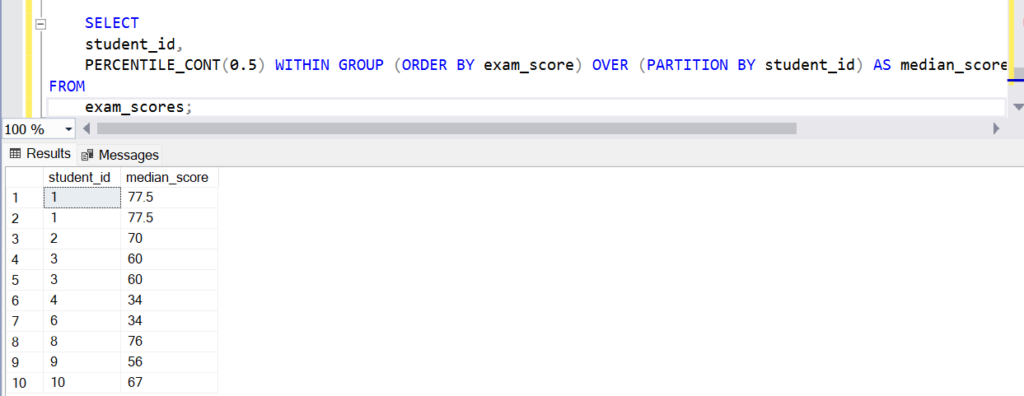
- PERCENTILE_CONT():
PERCENTILE_CONT is another window function in SQL that calculates a specific percentile value for a set of values within a group. This function is particularly useful when you want to find the value at a particular percentile within a dataset.
Syntax:
PERCENTILE_CONT(percentile) WITHIN GROUP (ORDER BY expression) OVER (PARTITION BY expression)percentile: This is the percentile value you want to calculate. It should be a value between 0 and 1. For example, to calculate the median (50th percentile), you would use 0.5.expression: This is the column or expression over which you want to calculate the percentile.PARTITION BY expression: This clause is optional and allows you to partition the data before calculating the percentile, similar to thePARTITION BYclause in other window functions.ORDER BY expression: This clause specifies the order in which the rows are processed within each partition. It determines the sequence of values used to calculate the percentile.
Example:
SELECT
    student_id,
    PERCENTILE_CONT(0.5) WITHIN GROUP (ORDER BY exam_score) OVER (PARTITION BY student_id) AS median_score
FROM
    exam_scores;
In this example, the PERCENTILE_CONT function is used to calculate the median (50th percentile) exam_score for each student_id group. The exam_scores table is partitioned by student_id, and within each partition, the exam_score values are ordered in ascending order before calculating the median.
Output:
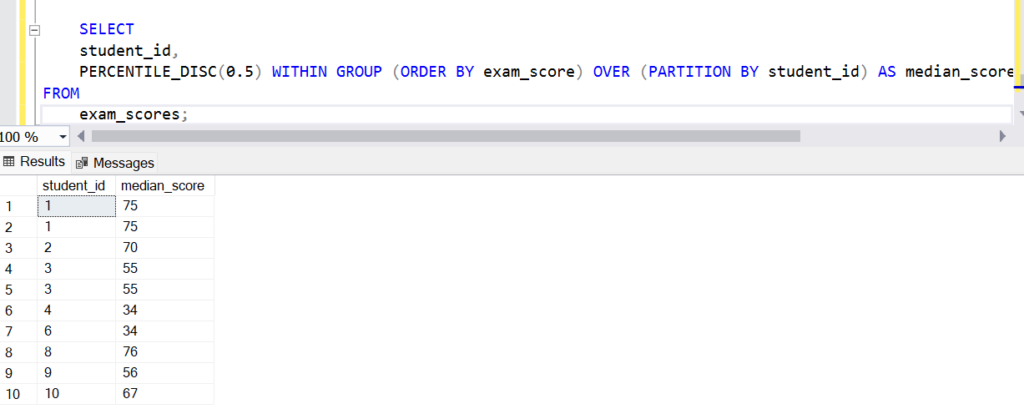
- PERCENTILE_DISC():
PERCENTILE_DISC is a window function in SQL that calculates a specific percentile value for a set of values within a group, similar to PERCENTILE_CONT. However, unlike PERCENTILE_CONT, which interpolates between values to calculate the percentile, PERCENTILE_DISC returns an actual value from the dataset.
Syntax:
PERCENTILE_DISC(percentile) WITHIN GROUP (ORDER BY expression) OVER (PARTITION BY expression)percentile: This is the percentile value you want to calculate. It should be a value between 0 and 1. For example, to calculate the median (50th percentile), you would use 0.5.expression: This is the column or expression over which you want to calculate the percentile.PARTITION BY expression: This clause is optional and allows you to partition the data before calculating the percentile, similar to thePARTITION BYclause in other window functions.ORDER BY expression: This clause specifies the order in which the rows are processed within each partition. It determines the sequence of values used to calculate the percentile.
Example:
SELECT
    student_id,
    PERCENTILE_DISC(0.5) WITHIN GROUP (ORDER BY exam_score) OVER (PARTITION BY student_id) AS median_score
FROM
    exam_scores;
In this example, the PERCENTILE_DISC function is used to calculate the median (50th percentile) exam_score for each student_id group. The exam_scores table is partitioned by student_id, and within each partition, the exam_score values are ordered in ascending order before calculating the median. Unlike PERCENTILE_CONT, PERCENTILE_DISC will return the actual exam_score value corresponding to the median, rather than interpolating between values.
Output:
5. Statistical Functions:
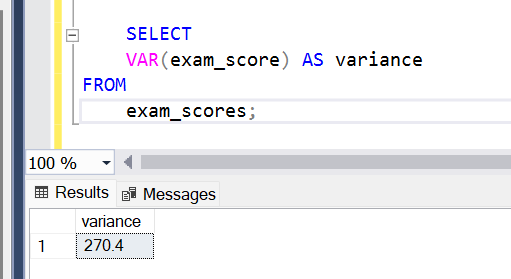
- VAR():
- Calculates the statistical variance of a numeric column over a specified range of rows.
In SQL, the VAR() function is used to calculate the variance of a set of values. Variance is a measure of how much the values in a dataset differ from the mean. It is calculated by taking the average of the squared differences between each value and the mean.
Syntax:
VAR(expression)expression: This is the column or expression for which you want to calculate the variance.
You can use the VAR() function to calculate the variance of a dataset across all rows, or you can use it with window functions to calculate the variance within groups or partitions.
Example:
SELECT
    VAR(exam_score) AS variance
FROM
    exam_scores;
In this example, VAR(exam_score) calculates the variance of the exam_score values across all rows in the exam_scores table.
Example:
SELECT
    student_id,
    VAR(exam_score) OVER (PARTITION BY student_id) AS variance_within_group
FROM
    exam_scores;
In this example, VAR(exam_score) OVER (PARTITION BY student_id) calculates the variance of exam_score within each student_id group. The PARTITION BY student_id clause partitions the data by student_id, so the variance is calculated separately for each group of students.
Output:
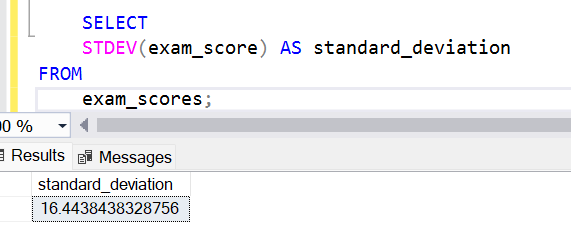
- STDEV():
- Calculates the statistical standard deviation of a numeric column over a specified range of rows.
In SQL, the STDEV() function is used to calculate the standard deviation of a set of values. Standard deviation is a measure of the amount of variation or dispersion in a dataset. It indicates how spread out the values are from the mean.
Syntax:
STDEV(expression)expression: This is the column or expression for which you want to calculate the standard deviation.
You can use the STDEV() function to calculate the standard deviation of a dataset across all rows, or you can use it with window functions to calculate the standard deviation within groups or partitions.
Example:
SELECT
    STDEV(exam_score) AS standard_deviation
FROM
    exam_scores;
In this example, STDEV(exam_score) calculates the standard deviation of the exam_score values across all rows in the exam_scores table.
Example:
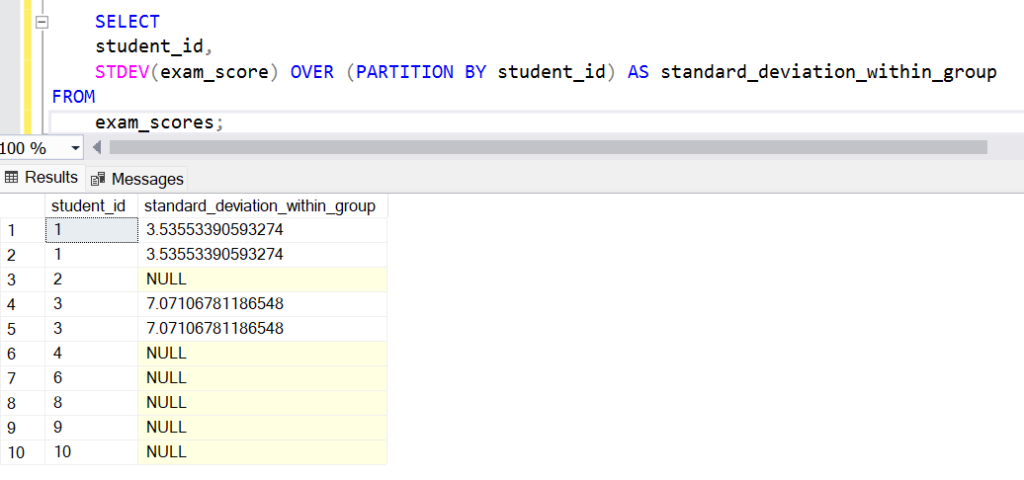
SELECT
    student_id,
    STDEV(exam_score) OVER (PARTITION BY student_id) AS standard_deviation_within_group
FROM
    exam_scores;
In this example, STDEV(exam_score) OVER (PARTITION BY student_id) calculates the standard deviation of exam_score within each student_id group. The PARTITION BY student_id clause partitions the data by student_id, so the standard deviation is calculated separately for each group of students.
Output:
Summary:
Microsoft provides various window functions that provide powerful capabilities for analyzing and transforming data in SQL Server. Understanding how to use these functions and incorporating them into your queries can greatly enhance your ability to perform complex analytical tasks.
